Air Quality in Real-Time May 2025 to Yesterday by Congressional District

***NOTE: Real-Time maps are maintained May through September***
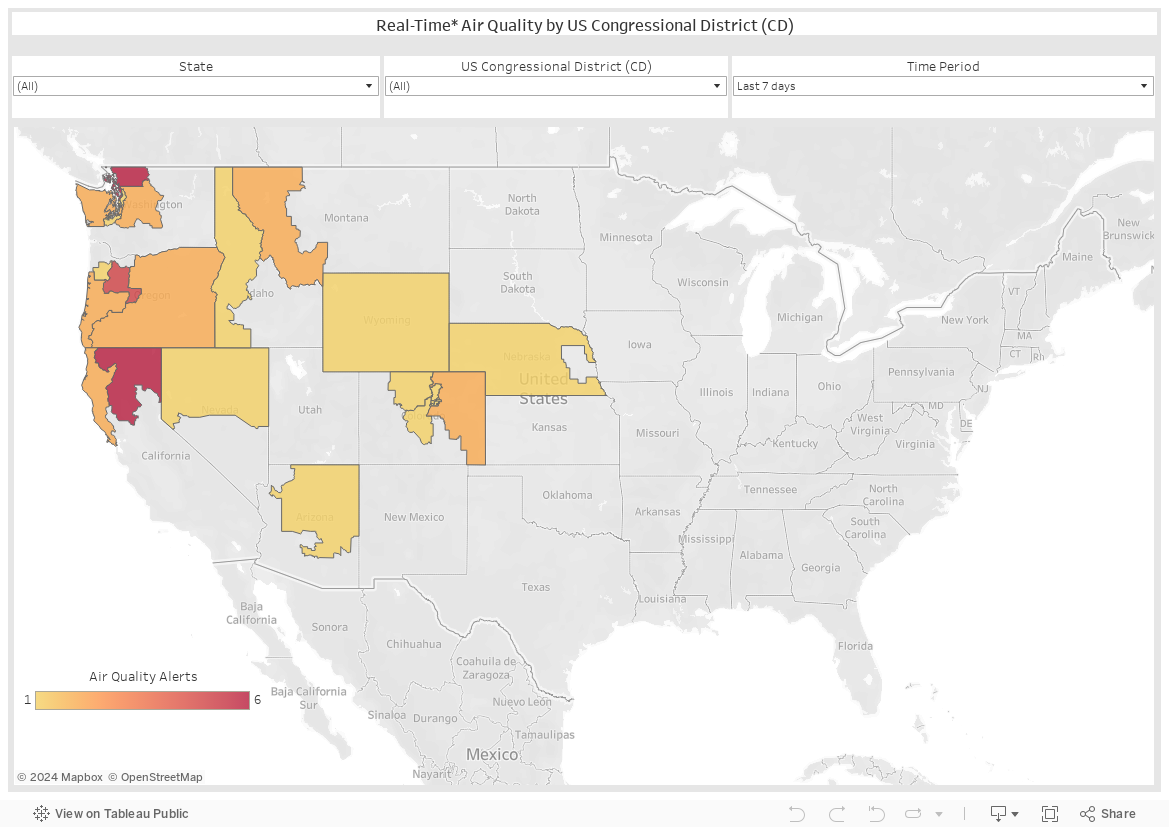
Use to reach people experiencing poor air quality now with real-time, reactive content. Use the map and download the data to create effective, hyper-local strategies.
Source: Free, public air quality data from AirNow.gov, mapping Air Quality Index (AQI) for PM 2.5 of 100+ which is categorized as Unhealthy for Sensitive Groups, Unhealthy, Very Unhealthy, or Hazardous. Maps created by the Innovation Hub.
To download the impacted congressional districts, click the ↓ in the lower right and select Crosstab, Air Quality Ex, Download.
To download the impacted congressional districts, click the ↓ in the lower right and select Crosstab, Air Quality Ex, Download.

Innovate With Us
We are in this together – and welcome your inquiries, contributions, and ideas.
Reach out to: